System context diagrams (level 1)
1. Defining the Product Ecosystem Scope
The System Context diagram represents the highest level of zoom in the C4 model. It establishes what is inside our product scope and how it connects to people, local home infrastructure, cloud backends, and external third-party services.
In our reference system—the Smart Home Environmental Monitor: - The Physical Sensor Device measures ambient temperature, relative humidity, volatile organic compounds (VOCs), and CO2 levels in the home. - The Smart Home Cloud Platform ingests real-time metrics, computes historical analytics, manages firmware update rollouts, and pushes alert notifications. - External Systems include local smart home hubs (for example, Home Assistant, Apple Home), third-party weather forecast APIs, and telecommunication carriers.

System Context diagram (Level 1) for the Smart Home Environmental Sensor ecosystem.
2. Matching PlantUML C4 Context Diagram
Below is the matching PlantUML C4 Context diagram using the standard C4_Context.puml library. The build toolchain automatically resolves the include from the repository’s templates/ folder:
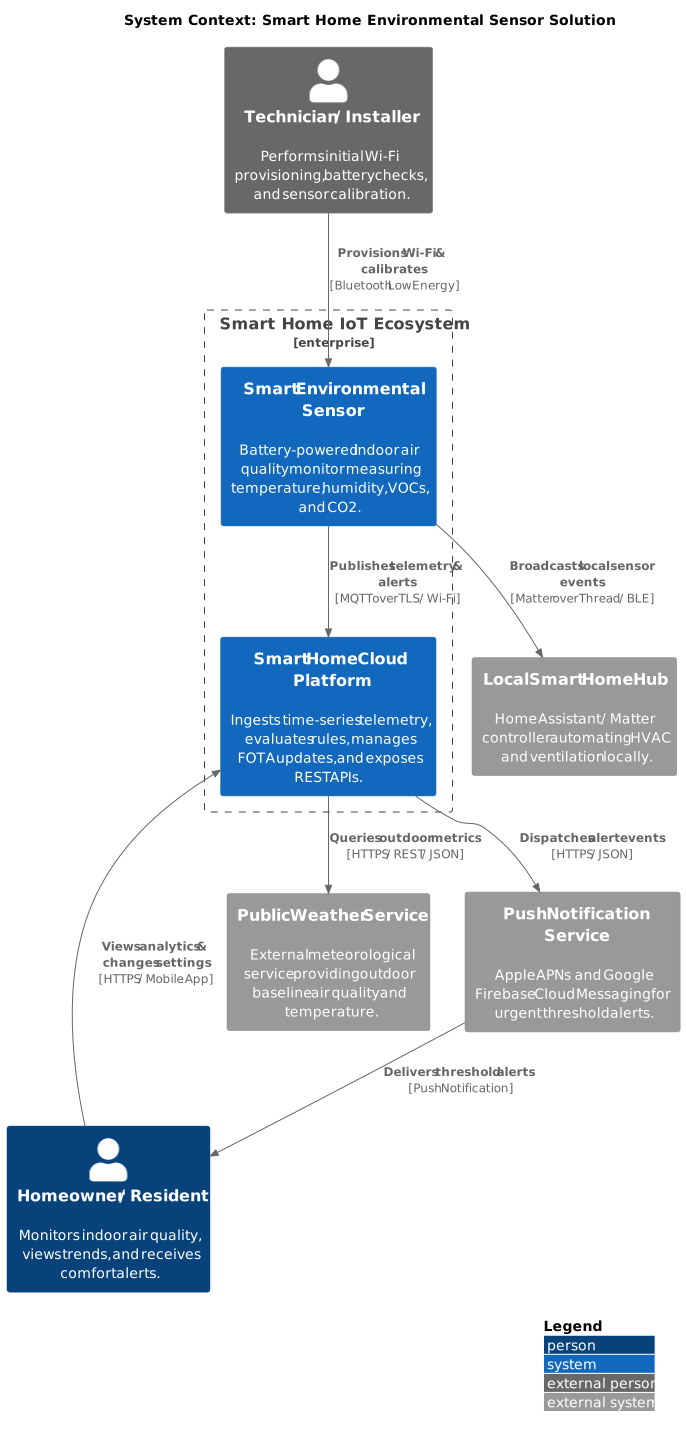
PlantUML C4 Context diagram for the Smart Home IoT ecosystem.
3. Key Relationships and Protocol Annotations
On an IoT Context diagram, always annotate connecting arrows with both the data intent and the transport layer:
| Interaction Path | Purpose / Description | Protocol & Physical Carrier |
|---|---|---|
| Sensor \(\rightarrow\) Cloud | Periodic telemetry frames, battery status, and threshold alerts | [MQTT over TLS / Wi-Fi @ 2.4 GHz] |
| Sensor \(\rightarrow\) Local Hub | Real-time sensor state broadcasts for instant local HVAC automations | [Matter over Thread / 802.15.4] |
| Technician \(\rightarrow\) Sensor | Initial credential onboarding, diagnostics, and factory calibration | [Bluetooth Low Energy (BLE) 5.0] |
| Cloud \(\rightarrow\) Weather Service | Ingesting external weather data for predictive heating models | [HTTPS / REST / JSON] |
| Mobile App \(\rightarrow\) Cloud | User dashboard telemetry views and configuration updates | [HTTPS / GraphQL & WebSockets] |
Interaction protocols for the Smart Home Sensor context diagram.
4. Tips & Tricks for Level 1 IoT Diagrams
- Model Both the Device and the Cloud: A common mistake is drawing only the physical hardware or only the cloud platform. A true IoT product system context must encompass the hardware edge, the local network, and the cloud services as unified actors.
- Differentiate Human Personas: Separate day-to-day residents from installation technicians. Technicians typically possess administrative privileges, local physical access (BLE/buttons), and different tools.
- Capture Offline Capabilities: In smart homes, cloud connectivity may fail while local automations must continue operating. Showing the local path (
Sensor -> Local Hub) immediately communicates resilience to stakeholders.