Charts and plots
Numbers drawn as charts. A chart block is drawn by py-doc itself as SVG. A plot is a short form that py-doc turns into Vega-Lite (or Vega). A vega-lite or vega fence takes a full specification, for any chart those draw.
chart: column
The default type. Each line is a label and a value for each series; series: names the series and adds a legend.
```chart type=column title="Messages a day, by firmware" unit=" msg" axis="Messages"
series: 2.0, 2.1
Office | 1440 | 610
Warehouse | 1440 | 980
Cold store | 1440 | 1210
Plant room | 1440 | 760
```
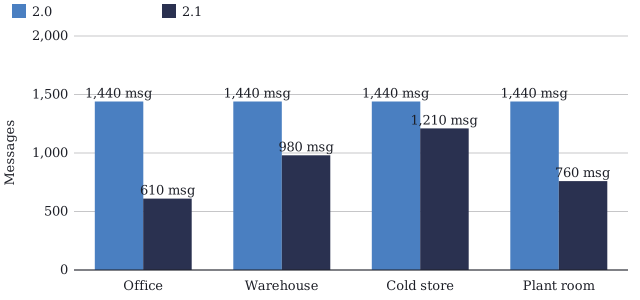
chart: bar
Horizontal bars, which suit long labels.
```chart type=bar title="Battery life, by site type" unit=" yr"
series: Measured, Specified
Office, heated | 5.7 | 5.0
Warehouse, unheated | 5.1 | 5.0
Cold store, -18 °C | 3.6 | 4.0
Plant room, 35 °C | 4.4 | 5.0
```
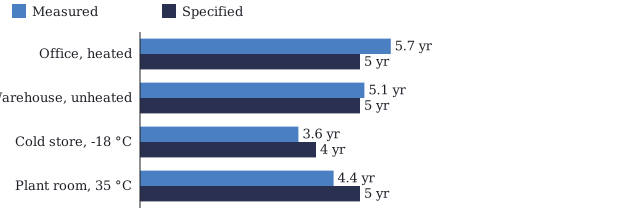
chart: line
Lines with markers, an area under each and a dashed target.
```chart type=line title="Nodes online, first week of the pilot" axis="Nodes" min=150 max=210 step=10 area=yes dashed=Target values=last
series: Leeds, Bristol, Target
Mon | 168 | 160 | 200
Tue | 181 | 172 | 200
Wed | 189 | 180 | 200
Thu | 194 | 184 | 200
Fri | 197 | 190 | 200
Sat | 198 | 193 | 200
Sun | 199 | 195 | 200
```
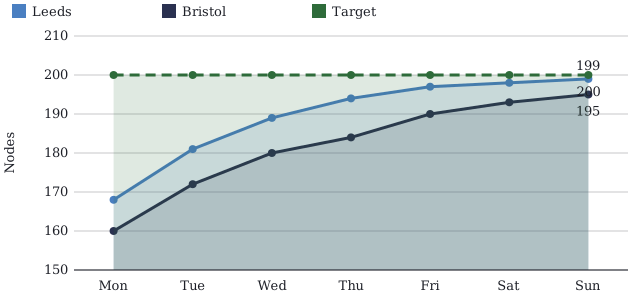
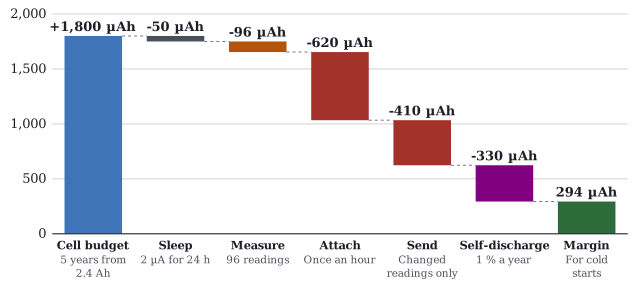
chart: waterfall
An amount, what is added to it and taken from it, and the totals between.
```chart type=waterfall title="Energy a day, µAh" unit=" µAh"
Cell budget | +1800 | blue | 5 years from 2.4 Ah
Sleep | -50 | grey | 2 µA for 24 h
Measure | -96 | amber | 96 readings
Attach | -620 | red | Once an hour
Send | -410 | red | Changed readings only
Self-discharge | -330 | purple | 1 % a year
Margin | =294 | green | For cold starts
```
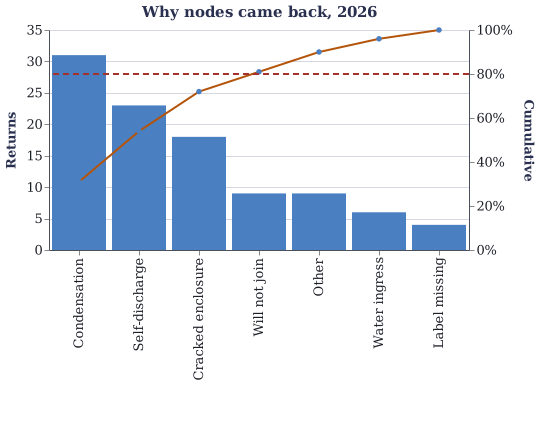
plot: Pareto
Causes in descending order, with the cumulative share and an 80 % guide.
```plot type=pareto title="Why nodes came back, 2026" ytitle="Returns"
Condensation | 31
Self-discharge | 23
Cracked enclosure | 18
Will not join | 9
Water ingress | 6
Label missing | 4
Other | 9
```
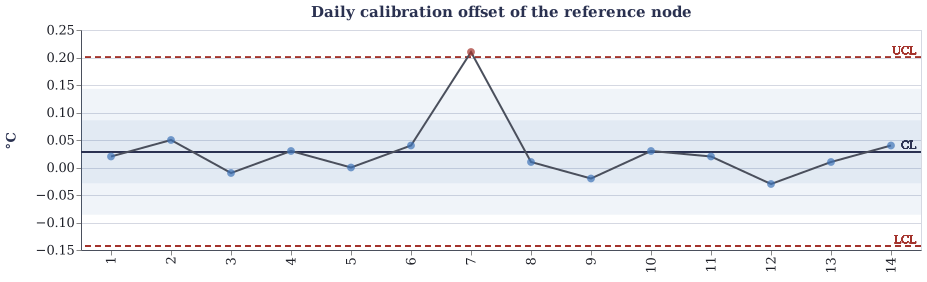
plot: control chart
Values in order with the centre line, sigma bands and control limits. Points outside the limits are marked.
```plot type=spc title="Daily calibration offset of the reference node" ytitle="°C"
1 | 0.02
2 | 0.05
3 | -0.01
4 | 0.03
5 | 0.00
6 | 0.04
7 | 0.21
8 | 0.01
9 | -0.02
10 | 0.03
11 | 0.02
12 | -0.03
13 | 0.01
14 | 0.04
```
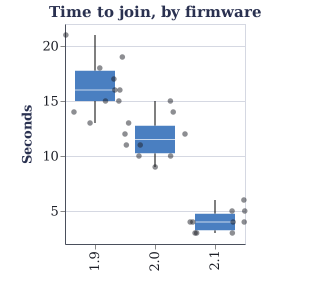
plot: box plot
The median, quartiles and whiskers of each group, with the samples.
```plot type=boxplot title="Time to join, by firmware" ytitle="Seconds" points=yes
1.9 | 14 16 13 18 15 21 17 16 19 15
2.0 | 9 11 12 10 14 13 11 15 10 12
2.1 | 3 4 4 5 3 6 4 4 5 3
```
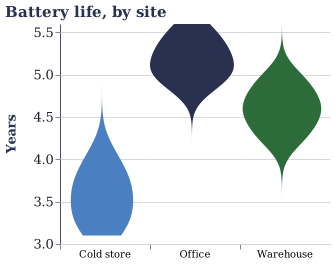
plot: violin
The shape of each group’s spread.
```plot type=violin title="Battery life, by site" ytitle="Years"
Office | 4.8 5.1 5.3 5.0 5.6 4.9 5.2 5.4 5.1 5.0 5.3 5.5
Warehouse | 4.2 4.6 4.9 4.4 5.0 4.7 4.5 4.8 4.3 4.6
Cold store | 3.1 3.6 3.9 3.3 4.1 3.5 3.8 3.4 3.7 3.2
```
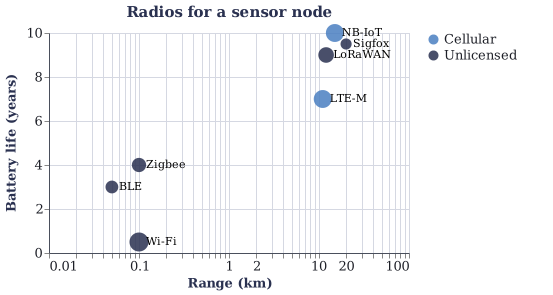
plot: scatter
Points by two values, sized and coloured by two more, on a log axis.
```plot type=scatter title="Radios for a sensor node" xlog=yes xtitle="Range (km)" ytitle="Battery life (years)" labels=yes
NB-IoT | 15 | 10 | 8 | Cellular
LTE-M | 11 | 7 | 8 | Cellular
LoRaWAN | 12 | 9 | 6 | Unlicensed
Sigfox | 20 | 9.5 | 3 | Unlicensed
Zigbee | 0.1 | 4 | 5 | Unlicensed
BLE | 0.05 | 3 | 4 | Unlicensed
Wi-Fi | 0.1 | 0.5 | 9 | Unlicensed
```
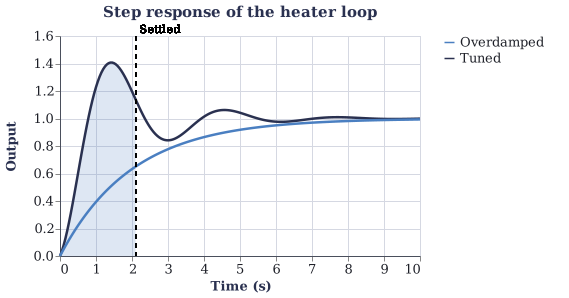
plot: function
Curves from expressions, a shaded area and marked values.
```plot type=function from=0 to=10 title="Step response of the heater loop" xtitle="Time (s)" ytitle="Output"
curve: Tuned | 1 - exp(-0.6 * x) * cos(2 * x)
curve: Overdamped | 1 - exp(-0.5 * x)
area: 0 | 2.1 | Rising
rule: 2.1 | Settled
```
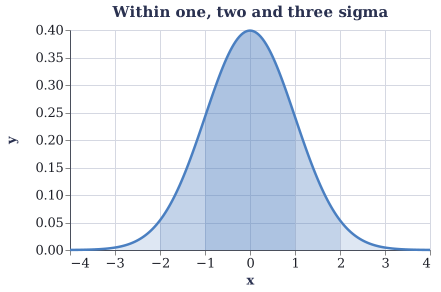
plot: the normal distribution
A preset of function: the normal curve with its sigma bands.
```plot type=function preset=normal title="Within one, two and three sigma"
```
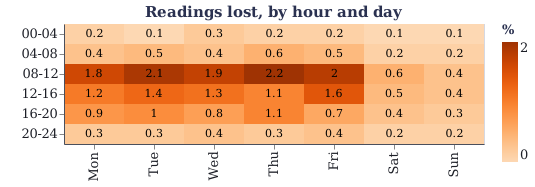
plot: heatmap
A table of values as coloured cells.
```plot type=heatmap title="Readings lost, by hour and day" unit="%" scheme=oranges
| Mon | Tue | Wed | Thu | Fri | Sat | Sun
00-04 | 0.2 | 0.1 | 0.3 | 0.2 | 0.2 | 0.1 | 0.1
04-08 | 0.4 | 0.5 | 0.4 | 0.6 | 0.5 | 0.2 | 0.2
08-12 | 1.8 | 2.1 | 1.9 | 2.2 | 2.0 | 0.6 | 0.4
12-16 | 1.2 | 1.4 | 1.3 | 1.1 | 1.6 | 0.5 | 0.4
16-20 | 0.9 | 1.0 | 0.8 | 1.1 | 0.7 | 0.4 | 0.3
20-24 | 0.3 | 0.3 | 0.4 | 0.3 | 0.4 | 0.2 | 0.2
```
plot: risk matrix
A preset of heatmap: likelihood by severity, with risks marked on it.
```plot type=heatmap preset=risk title="Risks of the 2.1 roll-out"
4 | 5 | R1
2 | 4 | R2
3 | 2 | R3
1 | 5 | R4
5 | 1 | R5
```
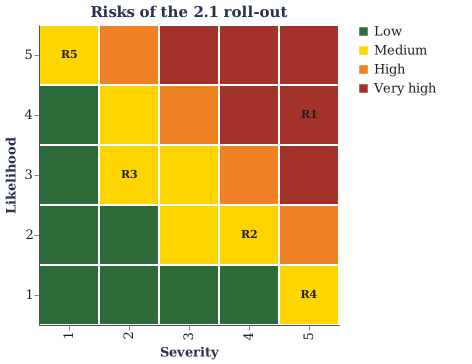
R1 is a node bricked by a power cut mid-update, and R2 the operator changing the band. R3 is a longer join on old gateways, R4 a leaked signing key and R5 the support calls of the first week.
plot: polar
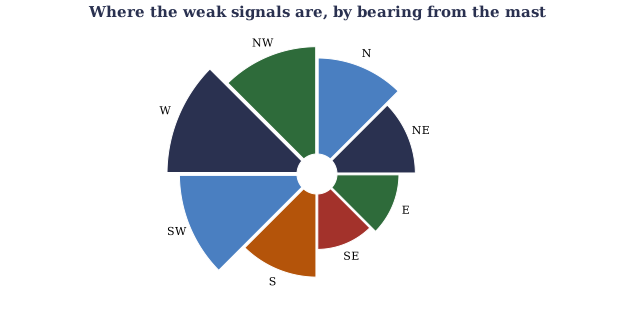
Equal slices with the value as their radius, as a wind rose.
```plot type=polar title="Where the weak signals are, by bearing from the mast"
N | 12
NE | 8
E | 5
SE | 4
S | 9
SW | 18
W | 22
NW | 15
```
plot: slope
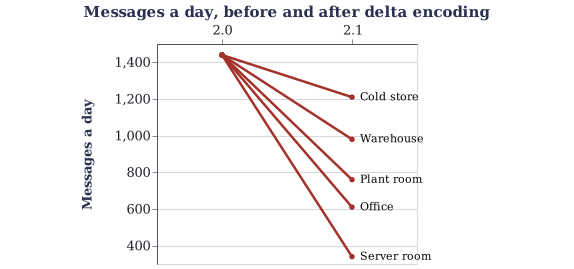
Values before and after, with rises and falls coloured.
```plot type=slope title="Messages a day, before and after delta encoding" ytitle="Messages a day"
| 2.0 | 2.1
Office | 1440 | 610
Warehouse | 1440 | 980
Cold store | 1440 | 1210
Plant room | 1440 | 760
Server room | 1440 | 340
```
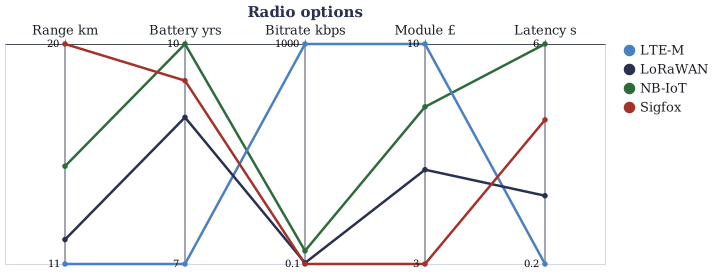
plot: parallel coordinates
Items across four or more axes, each scaled from its own lowest to highest value.
```plot type=parallel title="Radio options"
| Range km | Battery yrs | Bitrate kbps | Module £ | Latency s
NB-IoT | 15 | 10 | 60 | 8 | 6
LTE-M | 11 | 7 | 1000 | 10 | 0.2
LoRaWAN | 12 | 9 | 5 | 6 | 2
Sigfox | 20 | 9.5 | 0.1 | 3 | 4
```
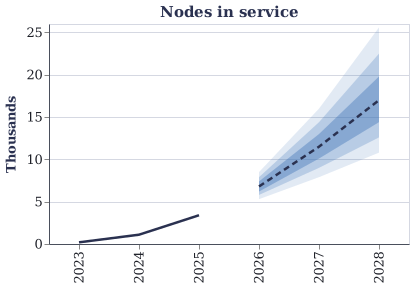
plot: forecast fan
History and a forecast with its 50, 80 and 95 % ranges.
```plot type=fan title="Nodes in service" ytitle="Thousands"
history: 2023 | 0.2
history: 2024 | 1.1
history: 2025 | 3.4
forecast: 2026 | 6.8 | 6.2 | 7.4 | 5.8 | 7.9 | 5.3 | 8.5
forecast: 2027 | 11.5 | 10.1 | 13.0 | 9.0 | 14.4 | 7.9 | 16.0
forecast: 2028 | 17.0 | 14.4 | 19.8 | 12.6 | 22.5 | 10.8 | 25.6
```
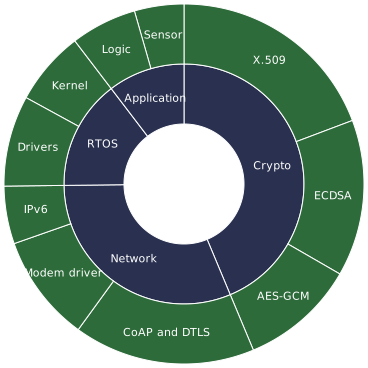
plot: sunburst
A hierarchy as rings, each slice the size of its value.
```plot type=sunburst title="Flash use of the firmware, KB"
Crypto / X.509 | 52
Crypto / ECDSA | 38
Crypto / AES-GCM | 28
Network / CoAP and DTLS | 44
Network / Modem driver | 26
Network / IPv6 | 14
RTOS / Kernel | 18
RTOS / Drivers | 22
Application / Sensor | 12
Application / Logic | 16
```
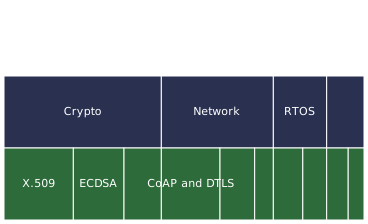
plot: icicle
The same hierarchy as partition bars.
```plot type=icicle title="Flash use of the firmware, KB"
Crypto / X.509 | 52
Crypto / ECDSA | 38
Crypto / AES-GCM | 28
Network / CoAP and DTLS | 44
Network / Modem driver | 26
Network / IPv6 | 14
RTOS / Kernel | 18
RTOS / Drivers | 22
Application / Sensor | 12
Application / Logic | 16
```
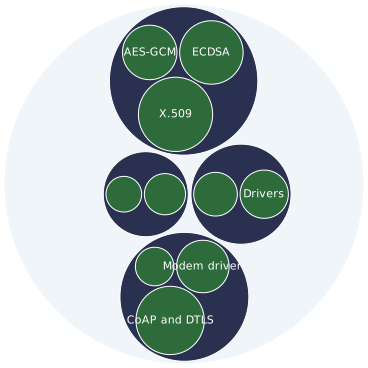
plot: circle packing
The same hierarchy as nested circles.
```plot type=pack title="Flash use of the firmware, KB"
Crypto / X.509 | 52
Crypto / ECDSA | 38
Crypto / AES-GCM | 28
Network / CoAP and DTLS | 44
Network / Modem driver | 26
Network / IPv6 | 14
RTOS / Kernel | 18
RTOS / Drivers | 22
Application / Sensor | 12
Application / Logic | 16
```
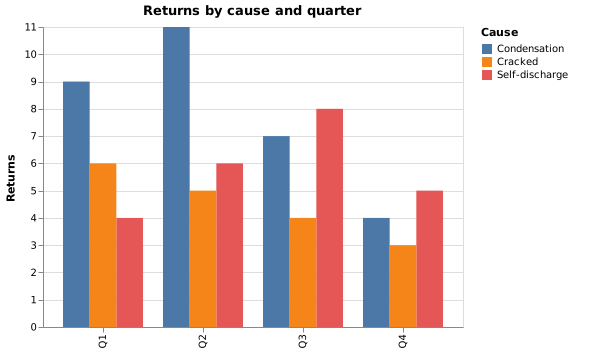
vega-lite: grouped bars
Any Vega-Lite specification. Here, bars grouped by an offset, with a tooltip-friendly encoding.
```vega-lite
{
  "title": "Returns by cause and quarter",
  "data": {"values": [
    {"q": "Q1", "cause": "Condensation", "n": 9}, {"q": "Q1", "cause": "Self-discharge", "n": 4}, {"q": "Q1", "cause": "Cracked", "n": 6},
    {"q": "Q2", "cause": "Condensation", "n": 11}, {"q": "Q2", "cause": "Self-discharge", "n": 6}, {"q": "Q2", "cause": "Cracked", "n": 5},
    {"q": "Q3", "cause": "Condensation", "n": 7}, {"q": "Q3", "cause": "Self-discharge", "n": 8}, {"q": "Q3", "cause": "Cracked", "n": 4},
    {"q": "Q4", "cause": "Condensation", "n": 4}, {"q": "Q4", "cause": "Self-discharge", "n": 5}, {"q": "Q4", "cause": "Cracked", "n": 3}
  ]},
  "mark": "bar",
  "width": 420,
  "encoding": {
    "x": {"field": "q", "type": "nominal", "title": null},
    "xOffset": {"field": "cause"},
    "y": {"field": "n", "type": "quantitative", "title": "Returns"},
    "color": {"field": "cause", "type": "nominal", "title": "Cause"}
  }
}
```
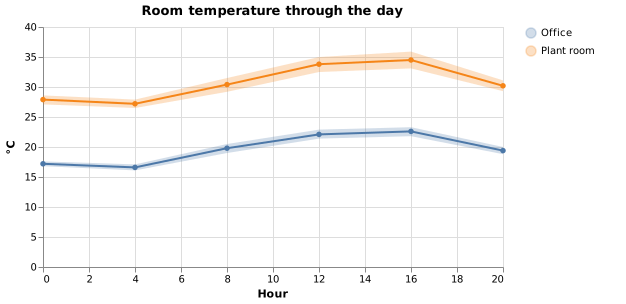
vega-lite: lines with a confidence band
A layer of an error band and a line, by series.
```vega-lite
{
  "title": "Room temperature through the day",
  "width": 460, "height": 240,
  "data": {"values": [
    {"h": 0, "room": "Office", "t": 17.2, "lo": 16.8, "hi": 17.6}, {"h": 4, "room": "Office", "t": 16.6, "lo": 16.1, "hi": 17.1},
    {"h": 8, "room": "Office", "t": 19.8, "lo": 19.0, "hi": 20.5}, {"h": 12, "room": "Office", "t": 22.1, "lo": 21.4, "hi": 22.9},
    {"h": 16, "room": "Office", "t": 22.6, "lo": 21.8, "hi": 23.3}, {"h": 20, "room": "Office", "t": 19.4, "lo": 18.8, "hi": 20.0},
    {"h": 0, "room": "Plant room", "t": 27.9, "lo": 27.1, "hi": 28.6}, {"h": 4, "room": "Plant room", "t": 27.2, "lo": 26.5, "hi": 27.9},
    {"h": 8, "room": "Plant room", "t": 30.4, "lo": 29.2, "hi": 31.5}, {"h": 12, "room": "Plant room", "t": 33.8, "lo": 32.5, "hi": 35.0},
    {"h": 16, "room": "Plant room", "t": 34.5, "lo": 33.1, "hi": 35.9}, {"h": 20, "room": "Plant room", "t": 30.2, "lo": 29.3, "hi": 31.1}
  ]},
  "encoding": {
    "x": {"field": "h", "type": "quantitative", "title": "Hour", "scale": {"domain": [0, 20]}},
    "color": {"field": "room", "type": "nominal", "title": null}
  },
  "layer": [
    {"mark": {"type": "errorband", "opacity": 0.25}, "encoding": {"y": {"field": "lo", "type": "quantitative", "title": "°C"}, "y2": {"field": "hi"}}},
    {"mark": {"type": "line", "point": true}, "encoding": {"y": {"field": "t", "type": "quantitative"}}}
  ]
}
```
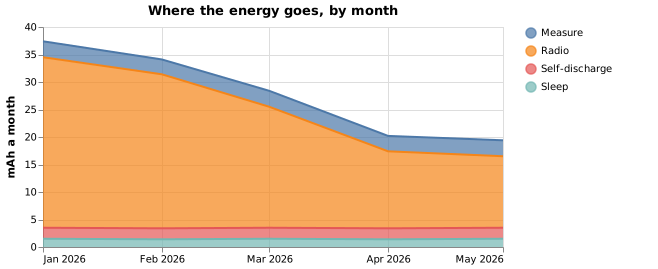
vega-lite: stacked area
Areas stacked by category over time.
```vega-lite
{
  "title": "Where the energy goes, by month",
  "width": 460, "height": 220,
  "data": {"values": [
    {"m": "2026-01", "use": "Radio", "mah": 31}, {"m": "2026-01", "use": "Sleep", "mah": 1.5}, {"m": "2026-01", "use": "Measure", "mah": 2.9}, {"m": "2026-01", "use": "Self-discharge", "mah": 2},
    {"m": "2026-02", "use": "Radio", "mah": 28}, {"m": "2026-02", "use": "Sleep", "mah": 1.4}, {"m": "2026-02", "use": "Measure", "mah": 2.7}, {"m": "2026-02", "use": "Self-discharge", "mah": 2},
    {"m": "2026-03", "use": "Radio", "mah": 22}, {"m": "2026-03", "use": "Sleep", "mah": 1.5}, {"m": "2026-03", "use": "Measure", "mah": 2.9}, {"m": "2026-03", "use": "Self-discharge", "mah": 2},
    {"m": "2026-04", "use": "Radio", "mah": 14}, {"m": "2026-04", "use": "Sleep", "mah": 1.4}, {"m": "2026-04", "use": "Measure", "mah": 2.8}, {"m": "2026-04", "use": "Self-discharge", "mah": 2},
    {"m": "2026-05", "use": "Radio", "mah": 13}, {"m": "2026-05", "use": "Sleep", "mah": 1.5}, {"m": "2026-05", "use": "Measure", "mah": 2.9}, {"m": "2026-05", "use": "Self-discharge", "mah": 2}
  ]},
  "mark": {"type": "area", "line": true},
  "encoding": {
    "x": {"field": "m", "type": "temporal", "timeUnit": "yearmonth", "title": null},
    "y": {"field": "mah", "type": "quantitative", "stack": "zero", "title": "mAh a month"},
    "color": {"field": "use", "type": "nominal", "title": null}
  }
}
```
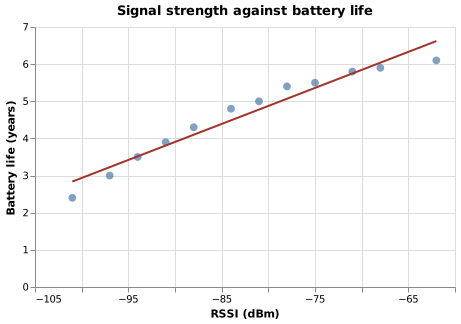
vega-lite: scatter with a regression line
Points and a fitted line, layered.
```vega-lite
{
  "title": "Signal strength against battery life",
  "width": 420, "height": 260,
  "data": {"values": [
    {"rssi": -62, "years": 6.1}, {"rssi": -68, "years": 5.9}, {"rssi": -71, "years": 5.8}, {"rssi": -75, "years": 5.5},
    {"rssi": -78, "years": 5.4}, {"rssi": -81, "years": 5.0}, {"rssi": -84, "years": 4.8}, {"rssi": -88, "years": 4.3},
    {"rssi": -91, "years": 3.9}, {"rssi": -94, "years": 3.5}, {"rssi": -97, "years": 3.0}, {"rssi": -101, "years": 2.4}
  ]},
  "encoding": {
    "x": {"field": "rssi", "type": "quantitative", "title": "RSSI (dBm)", "scale": {"zero": false}},
    "y": {"field": "years", "type": "quantitative", "title": "Battery life (years)"}
  },
  "layer": [
    {"mark": {"type": "point", "filled": true, "size": 60}},
    {"mark": {"type": "line", "color": "#a3322b"}, "transform": [{"regression": "years", "on": "rssi"}]}
  ]
}
```
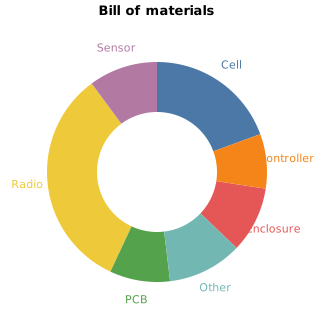
vega-lite: donut
An arc mark with an inner radius and its labels.
```vega-lite
{
  "title": "Bill of materials",
  "data": {"values": [
    {"part": "Radio", "gbp": 7.8}, {"part": "Cell", "gbp": 4.6}, {"part": "Sensor", "gbp": 2.4},
    {"part": "Enclosure", "gbp": 2.3}, {"part": "PCB", "gbp": 2.1}, {"part": "Controller", "gbp": 1.9}, {"part": "Other", "gbp": 2.6}
  ]},
  "layer": [
    {"mark": {"type": "arc", "innerRadius": 60, "outerRadius": 110}},
    {"mark": {"type": "text", "radius": 130}, "encoding": {"text": {"field": "part"}}}
  ],
  "encoding": {
    "theta": {"field": "gbp", "type": "quantitative", "stack": true},
    "color": {"field": "part", "type": "nominal", "legend": null}
  },
  "view": {"stroke": null}
}
```
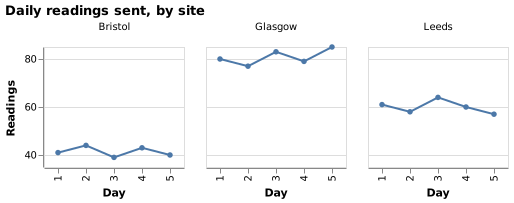
vega-lite: small multiples
One chart a facet, with shared axes.
```vega-lite
{
  "title": "Daily readings sent, by site",
  "data": {"values": [
    {"site": "Leeds", "day": 1, "n": 61}, {"site": "Leeds", "day": 2, "n": 58}, {"site": "Leeds", "day": 3, "n": 64}, {"site": "Leeds", "day": 4, "n": 60}, {"site": "Leeds", "day": 5, "n": 57},
    {"site": "Bristol", "day": 1, "n": 41}, {"site": "Bristol", "day": 2, "n": 44}, {"site": "Bristol", "day": 3, "n": 39}, {"site": "Bristol", "day": 4, "n": 43}, {"site": "Bristol", "day": 5, "n": 40},
    {"site": "Glasgow", "day": 1, "n": 80}, {"site": "Glasgow", "day": 2, "n": 77}, {"site": "Glasgow", "day": 3, "n": 83}, {"site": "Glasgow", "day": 4, "n": 79}, {"site": "Glasgow", "day": 5, "n": 85}
  ]},
  "facet": {"column": {"field": "site", "type": "nominal", "title": null}},
  "spec": {
    "width": 140, "height": 120,
    "mark": {"type": "line", "point": true},
    "encoding": {
      "x": {"field": "day", "type": "ordinal", "title": "Day"},
      "y": {"field": "n", "type": "quantitative", "title": "Readings", "scale": {"zero": false}}
    }
  }
}
```
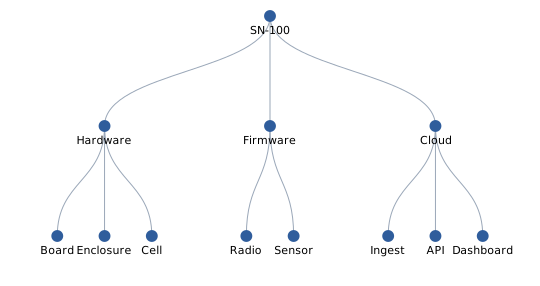
vega: a tree layout
A full Vega specification: here a tidy tree from a table of parents and children.
```vega
{
  "$schema": "https://vega.github.io/schema/vega/v6.json",
  "width": 520, "height": 260, "padding": 10,
  "data": [
    {
      "name": "tree",
      "values": [
        {"id": 1, "name": "SN-100"},
        {"id": 2, "name": "Hardware", "parent": 1}, {"id": 3, "name": "Firmware", "parent": 1}, {"id": 4, "name": "Cloud", "parent": 1},
        {"id": 5, "name": "Board", "parent": 2}, {"id": 6, "name": "Enclosure", "parent": 2}, {"id": 7, "name": "Cell", "parent": 2},
        {"id": 8, "name": "Radio", "parent": 3}, {"id": 9, "name": "Sensor", "parent": 3},
        {"id": 10, "name": "Ingest", "parent": 4}, {"id": 11, "name": "API", "parent": 4}, {"id": 12, "name": "Dashboard", "parent": 4}
      ],
      "transform": [
        {"type": "stratify", "key": "id", "parentKey": "parent"},
        {"type": "tree", "method": "tidy", "size": [{"signal": "width"}, {"signal": "height - 40"}], "as": ["x", "y", "depth", "children"]}
      ]
    },
    {"name": "links", "source": "tree", "transform": [{"type": "treelinks"}, {"type": "linkpath", "orient": "vertical", "shape": "diagonal"}]}
  ],
  "marks": [
    {"type": "path", "from": {"data": "links"}, "encode": {"update": {"path": {"field": "path"}, "stroke": {"value": "#9aa7b8"}}}},
    {"type": "symbol", "from": {"data": "tree"}, "encode": {"enter": {"size": {"value": 140}, "fill": {"value": "#2f5d9c"}}, "update": {"x": {"field": "x"}, "y": {"field": "y"}}}},
    {"type": "text", "from": {"data": "tree"}, "encode": {"enter": {"text": {"field": "name"}, "fontSize": {"value": 11}, "baseline": {"value": "top"}, "align": {"value": "center"}, "dy": {"value": 9}}, "update": {"x": {"field": "x"}, "y": {"field": "y"}}}}
  ]
}
```
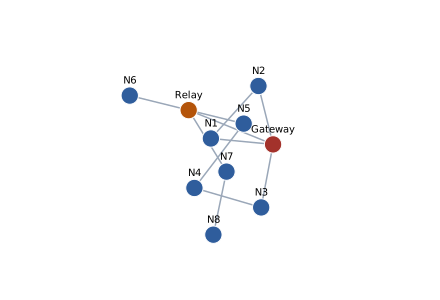
vega: a force-directed graph
Vega’s force transform settles nodes and links.
```vega
{
  "$schema": "https://vega.github.io/schema/vega/v6.json",
  "width": 420, "height": 280, "padding": 10,
  "data": [
    {"name": "nodes", "values": [
      {"name": "Gateway", "g": 0}, {"name": "N1", "g": 1}, {"name": "N2", "g": 1}, {"name": "N3", "g": 1}, {"name": "N4", "g": 1},
      {"name": "N5", "g": 1}, {"name": "N6", "g": 1}, {"name": "Relay", "g": 2}, {"name": "N7", "g": 1}, {"name": "N8", "g": 1}
    ]},
    {"name": "links", "values": [
      {"source": 0, "target": 1}, {"source": 0, "target": 2}, {"source": 0, "target": 3}, {"source": 0, "target": 7},
      {"source": 1, "target": 2}, {"source": 3, "target": 4}, {"source": 7, "target": 5}, {"source": 7, "target": 6},
      {"source": 7, "target": 8}, {"source": 8, "target": 9}, {"source": 4, "target": 5}
    ]}
  ],
  "scales": [{"name": "colour", "type": "ordinal", "domain": [0, 1, 2], "range": ["#a3322b", "#2f5d9c", "#b4540a"]}],
  "marks": [
    {
      "name": "points", "type": "symbol", "zindex": 1, "from": {"data": "nodes"},
      "encode": {"enter": {"fill": {"scale": "colour", "field": "g"}, "size": {"value": 300}, "stroke": {"value": "white"}}},
      "transform": [{"type": "force", "iterations": 300, "static": true, "forces": [
        {"force": "center", "x": {"signal": "width / 2"}, "y": {"signal": "height / 2"}},
        {"force": "collide", "radius": 18}, {"force": "nbody", "strength": -60},
        {"force": "link", "links": "links", "distance": 55}
      ]}]
    },
    {"type": "path", "from": {"data": "links"}, "interactive": false,
     "encode": {"update": {"stroke": {"value": "#9aa7b8"}, "strokeWidth": {"value": 1.5}}},
     "transform": [{"type": "linkpath", "shape": "line", "sourceX": "datum.source.x", "sourceY": "datum.source.y", "targetX": "datum.target.x", "targetY": "datum.target.y"}]},
    {"type": "text", "from": {"data": "points"}, "zindex": 2,
     "encode": {"update": {"text": {"field": "datum.name"}, "x": {"field": "x"}, "y": {"field": "y"}, "dy": {"value": -12}, "align": {"value": "center"}, "fontSize": {"value": 10}}}}
  ]
}
```